- Thank you, Mrs Walsh, for inviting me to your classes.
- Thank you, students, for filling out the anonymous survey I created.
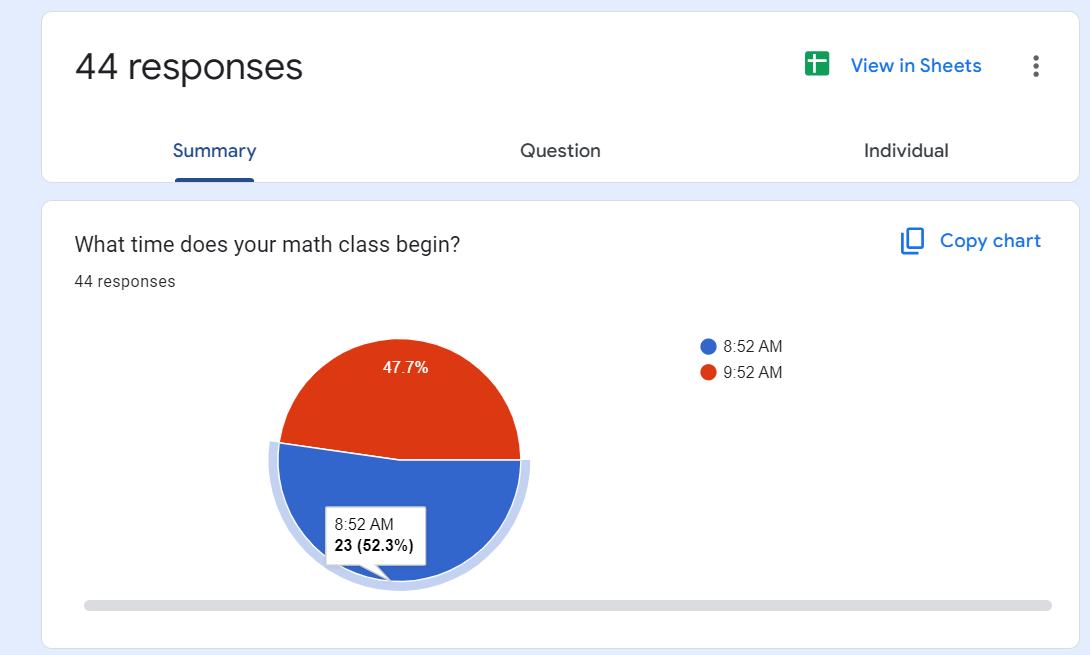
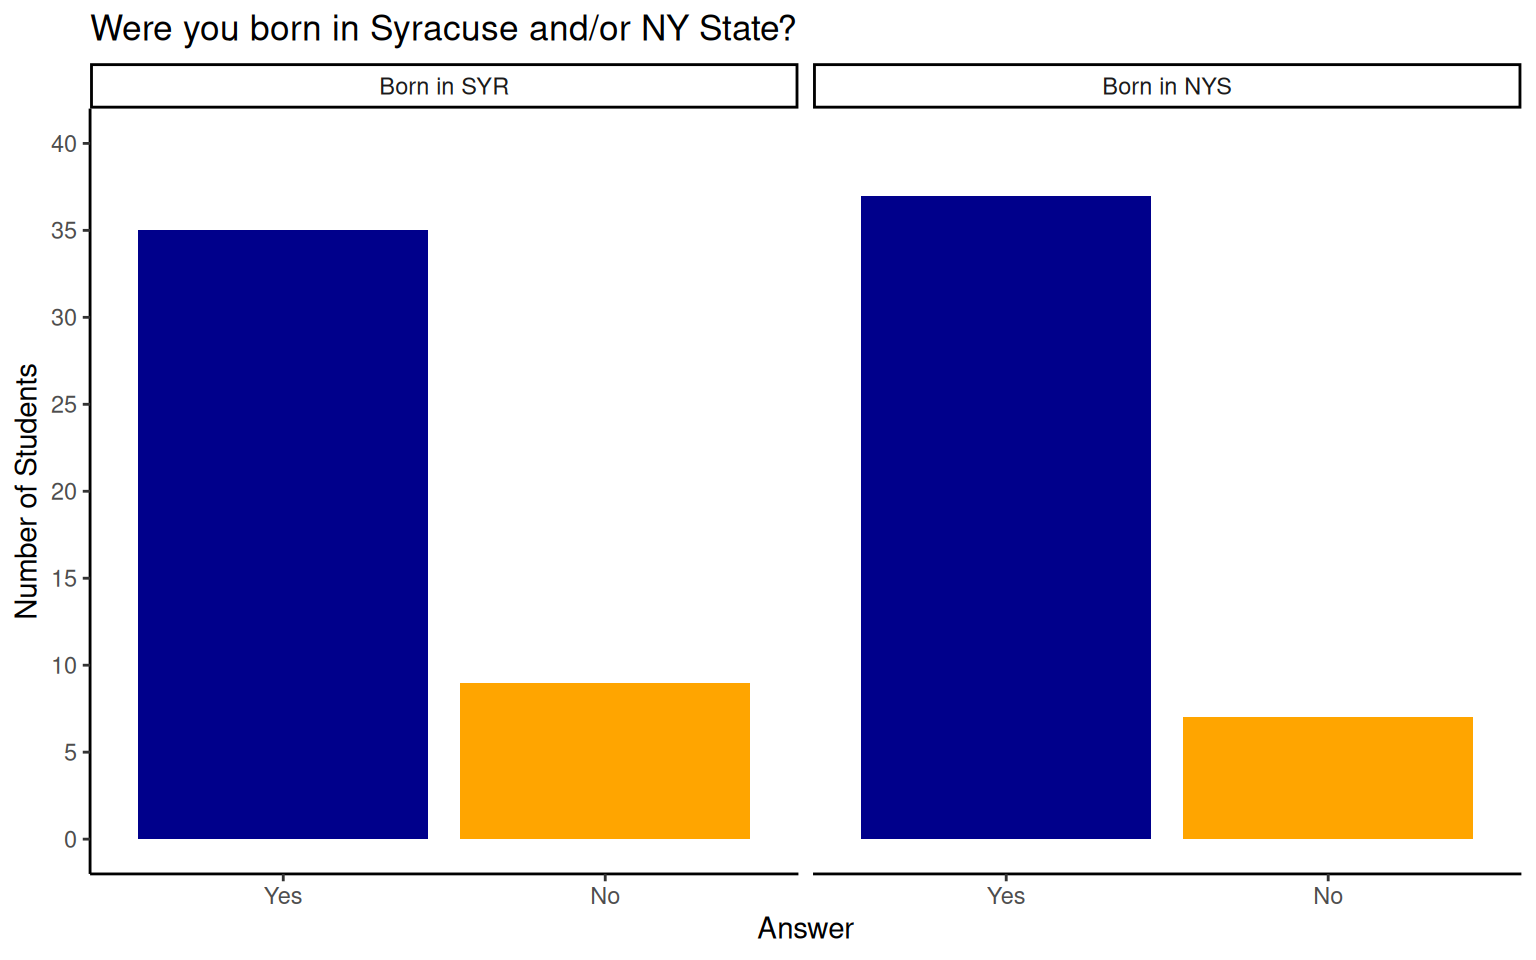
- 44 Students responded to the survey I provided.
- Google Forms is great for collecting data and creating basic summaries.
- This dashboard goes a little further than the Google Forms summaries.
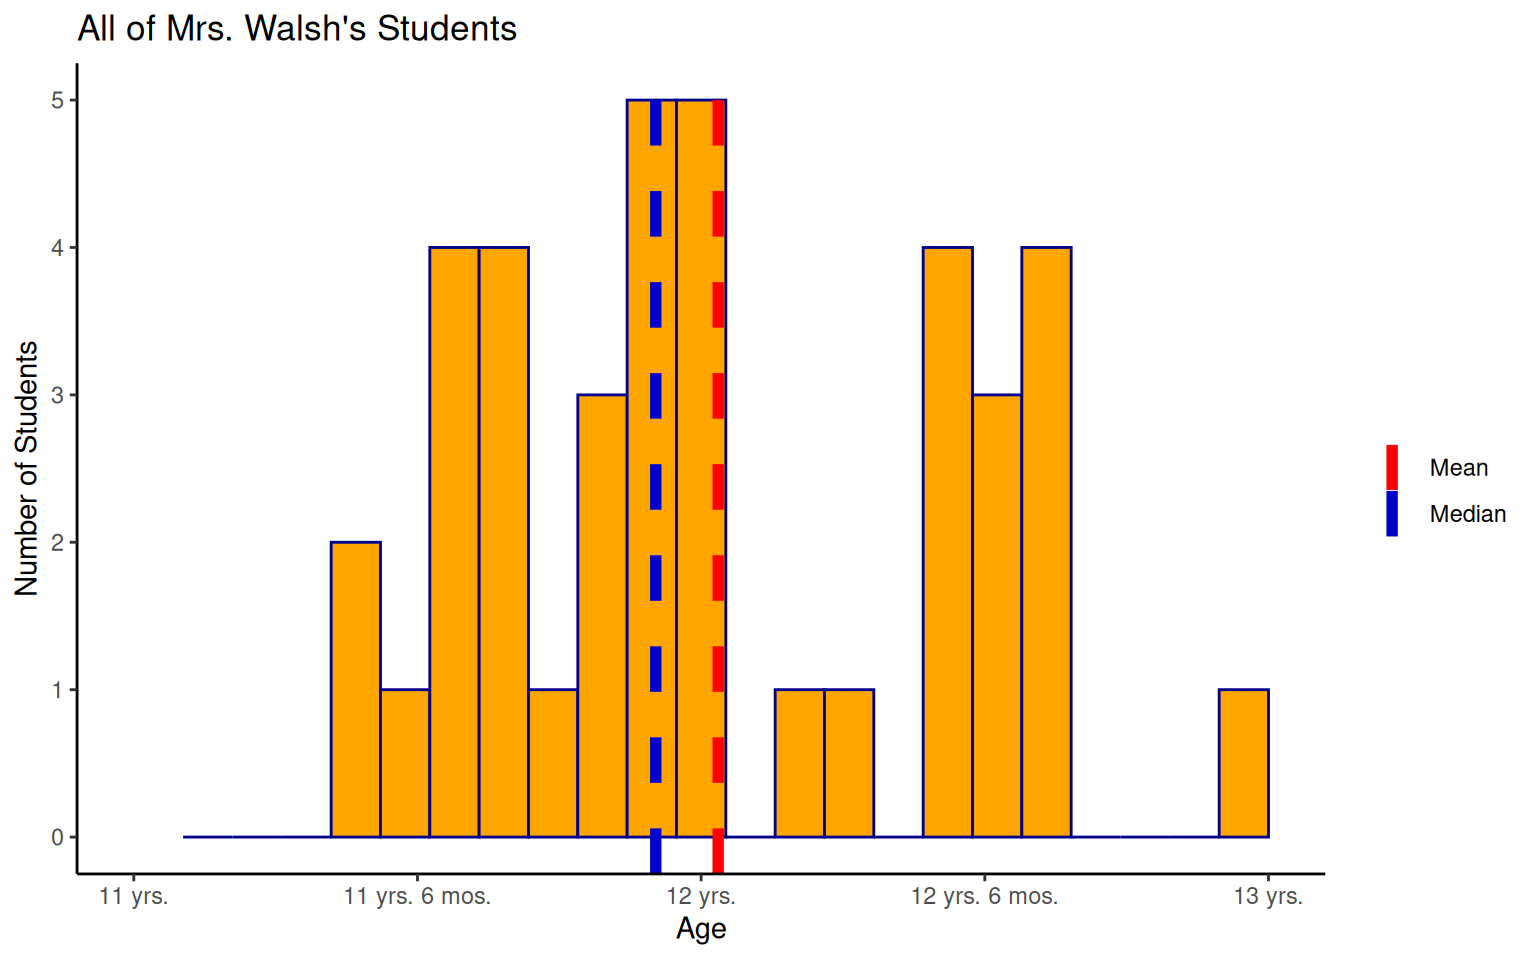
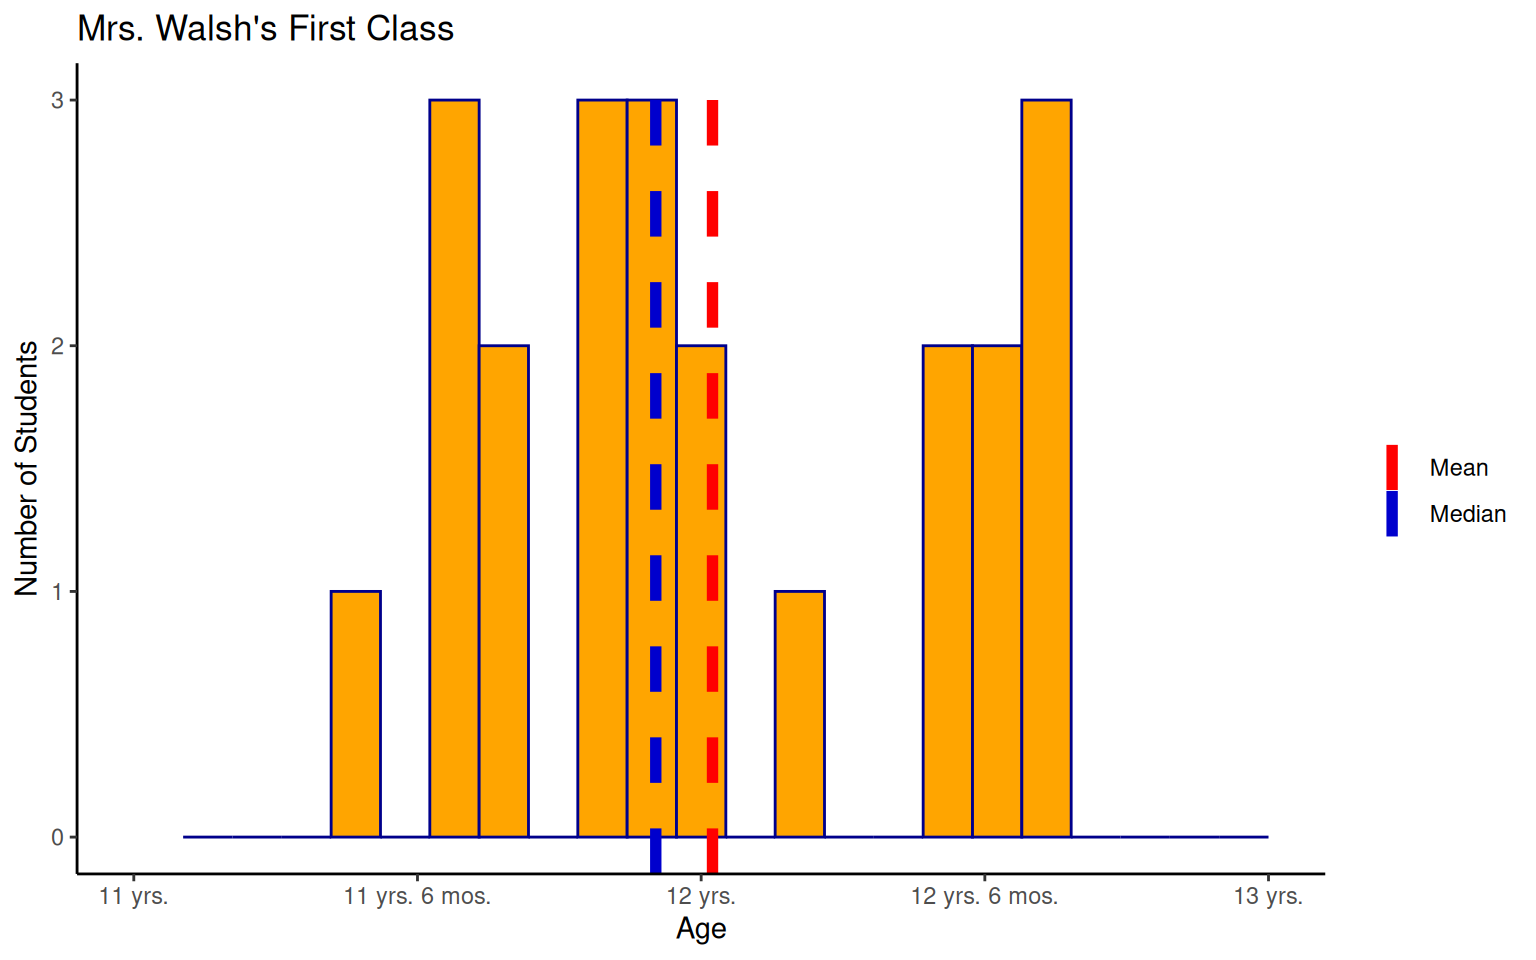
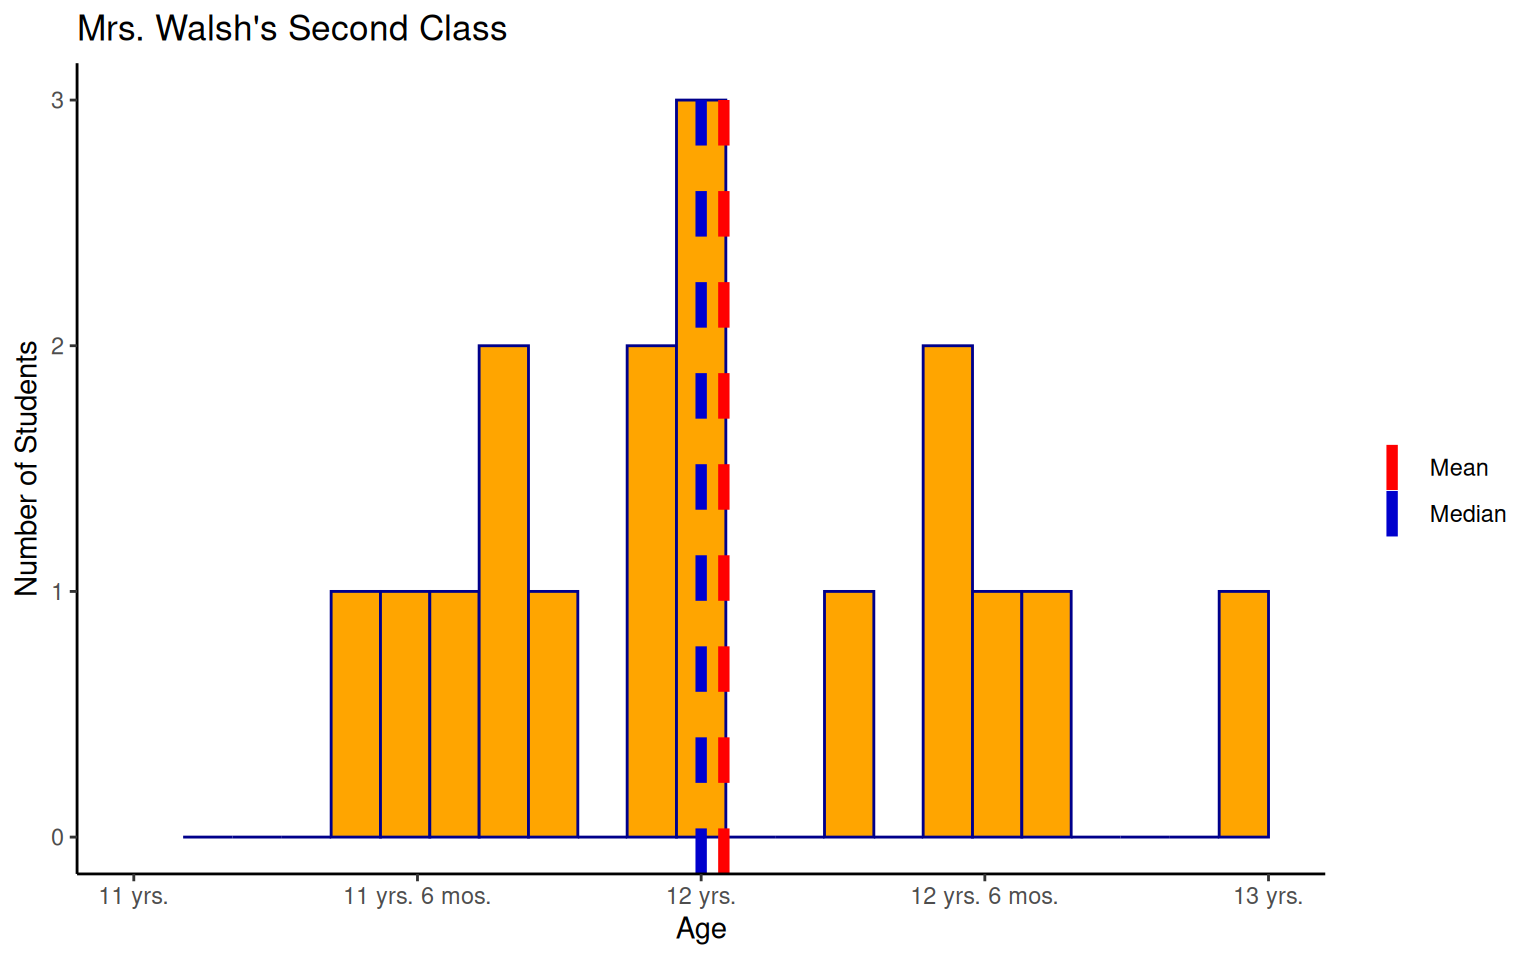
- Histograms are used to examine numerical data.
- Red dashed line shows mean (average) age.
- Blue dashed line shows median (middle) age.

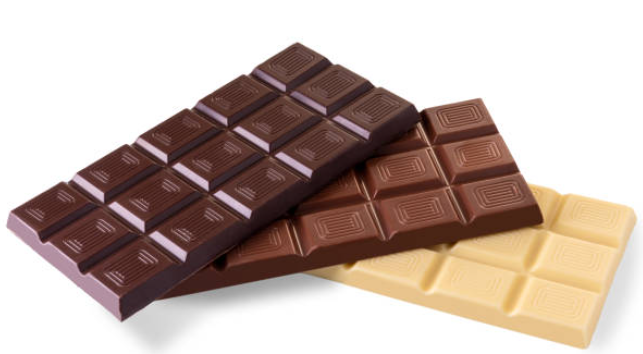
The two classes have similar but not identical chocolate preferences.
Milk Chocolate received \(\frac{34}{60}=56\%\) of the votes.
- Note that students could vote for more than one type of chocolate so there were 60 answers submitted.
- How do your preferences compare to Google Trends for the past week?
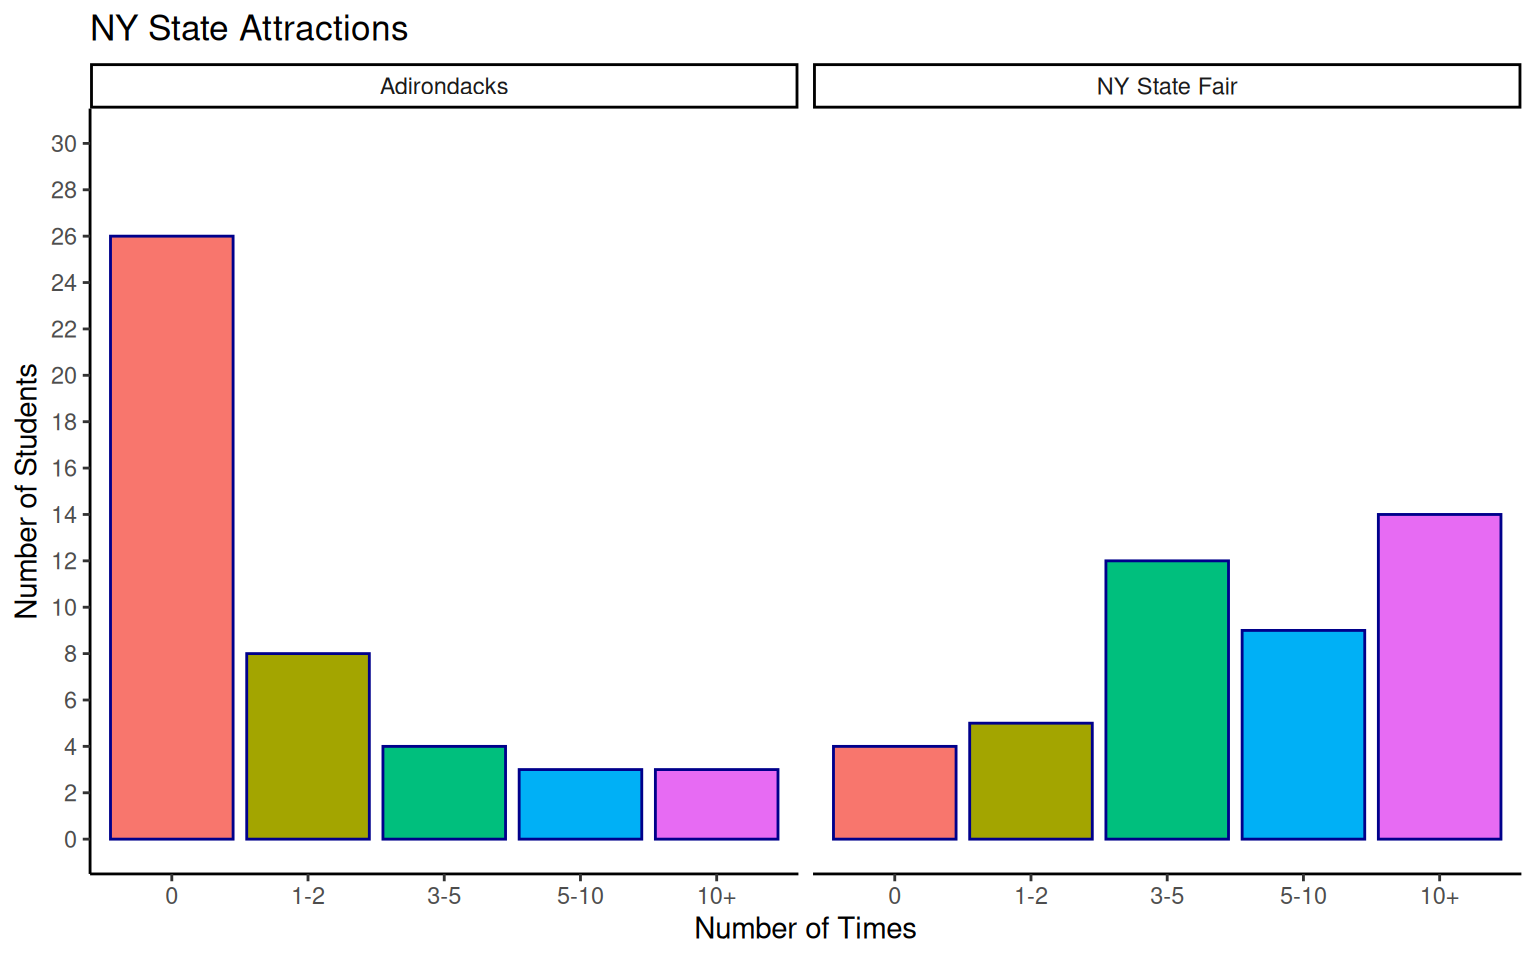
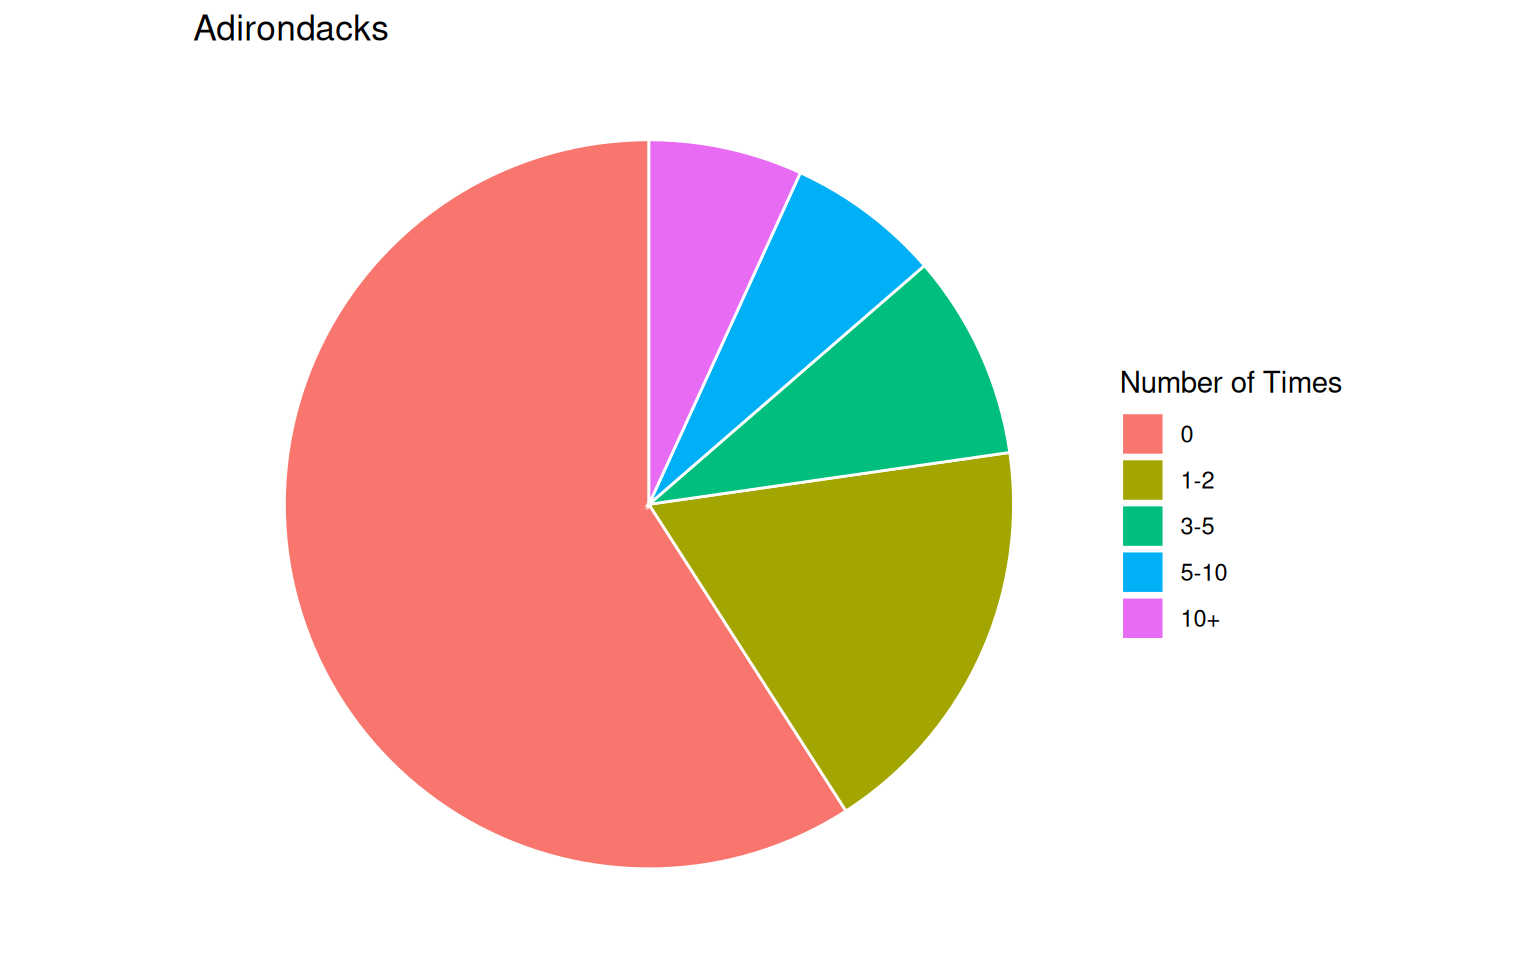

- The Adirondack State Park is the LARGEST park in the contiguous 48 united states.
- The park includes 6.1 MILLION ACRES and about half of the land within the park is private, which is unique.
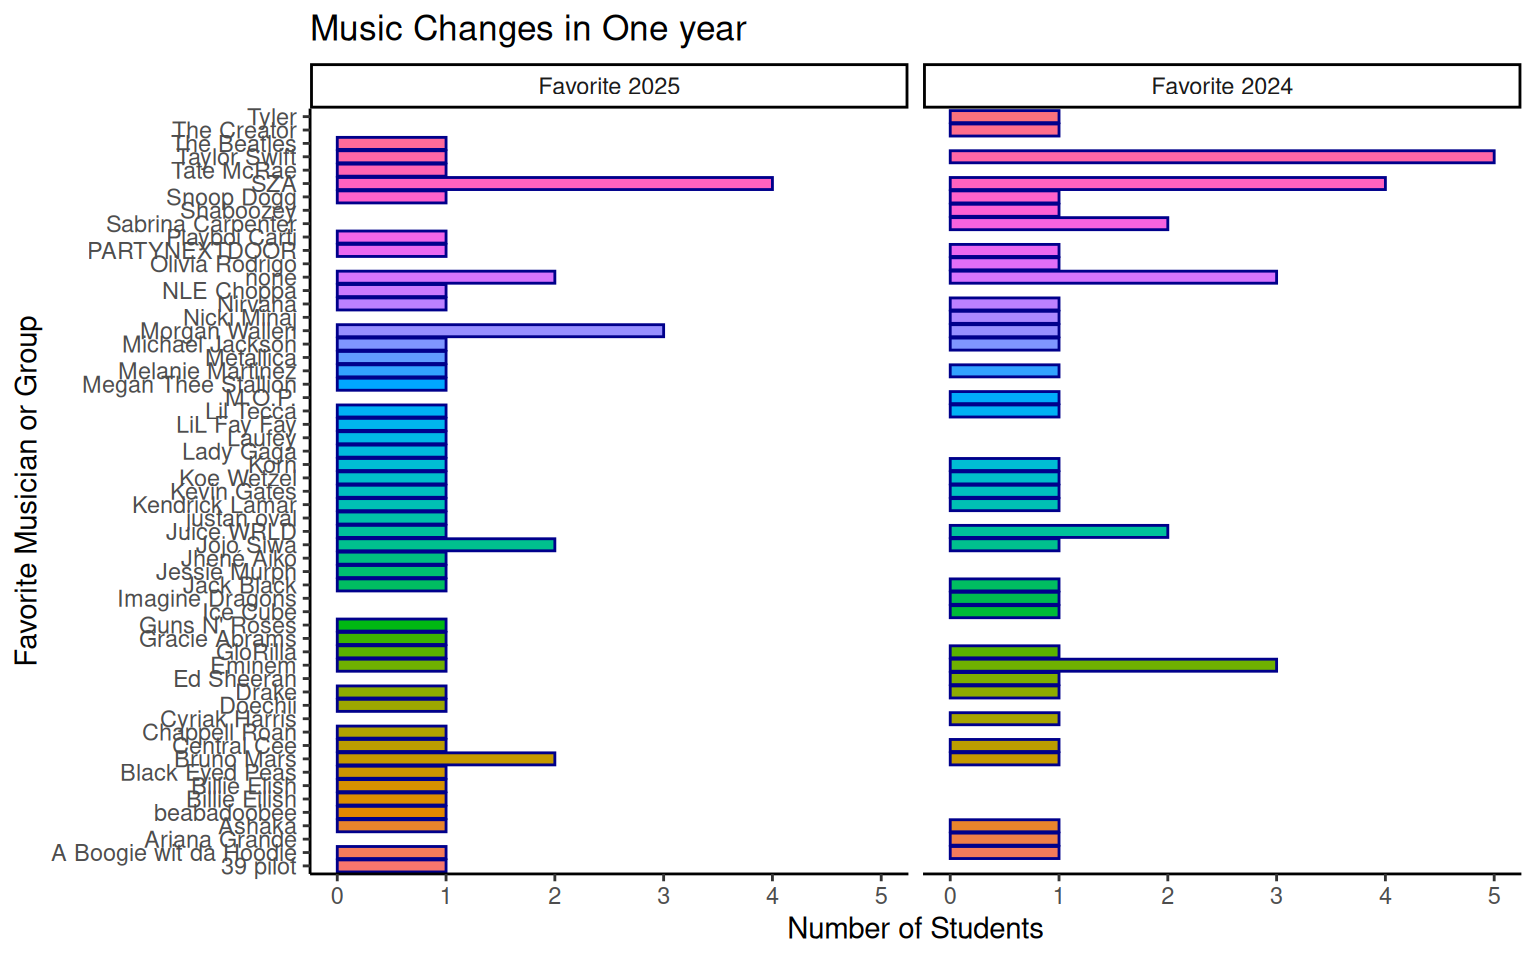
- These data were edited to correct spelling, BUT there were still TOO MANY UNIQUE responses to examine these data with a bar chart.
- When asking free-form questions, summarizing the responses requires another option.
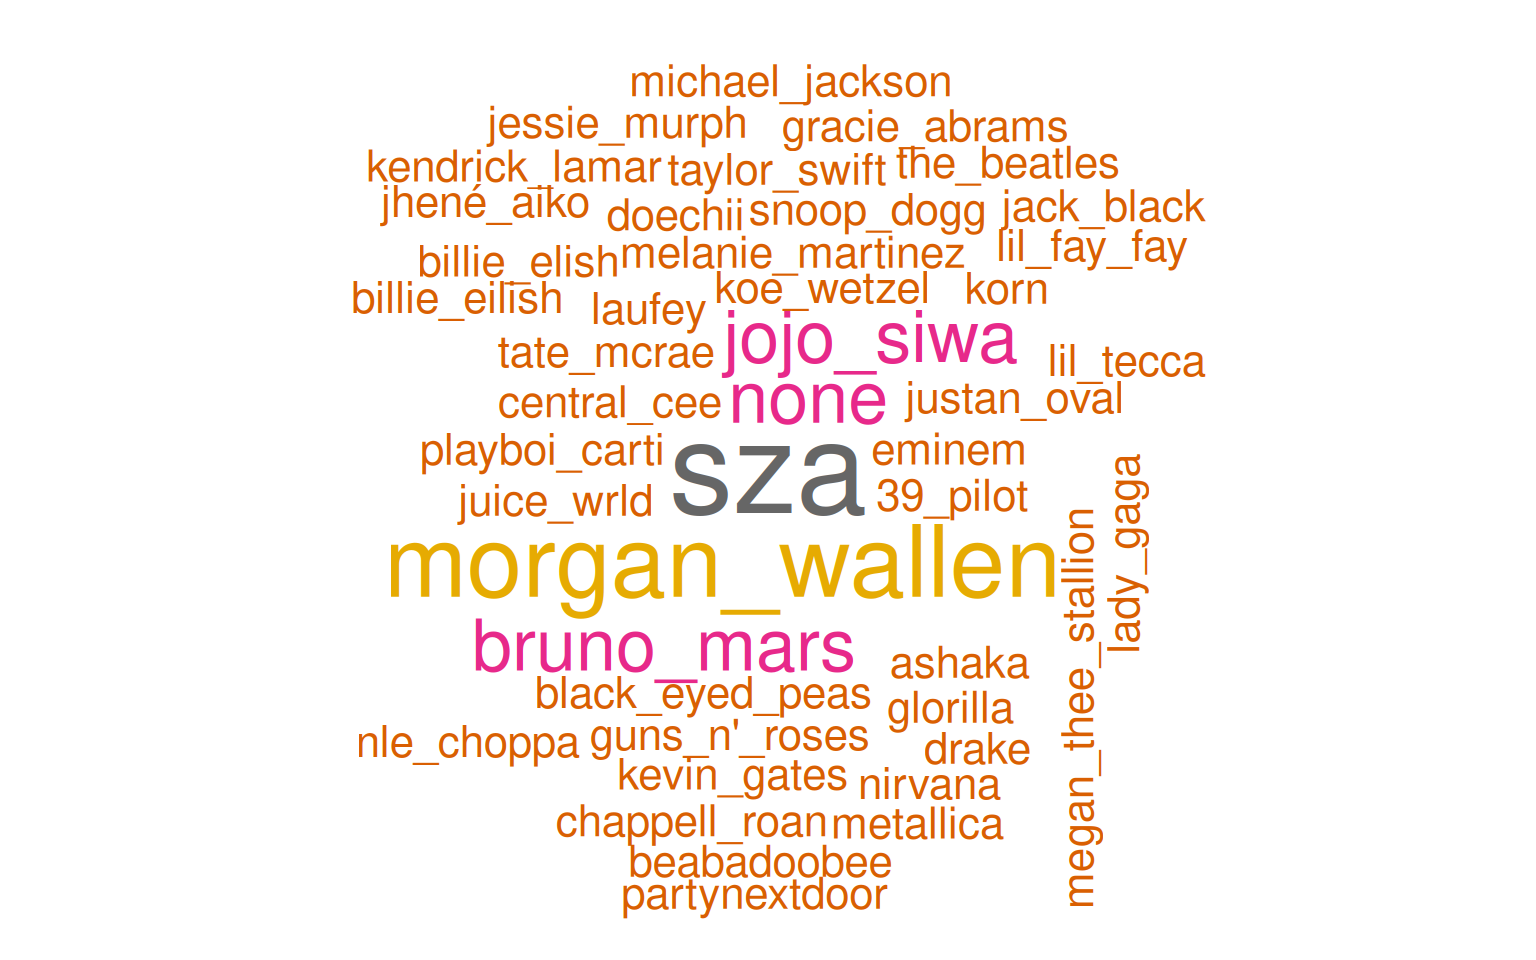
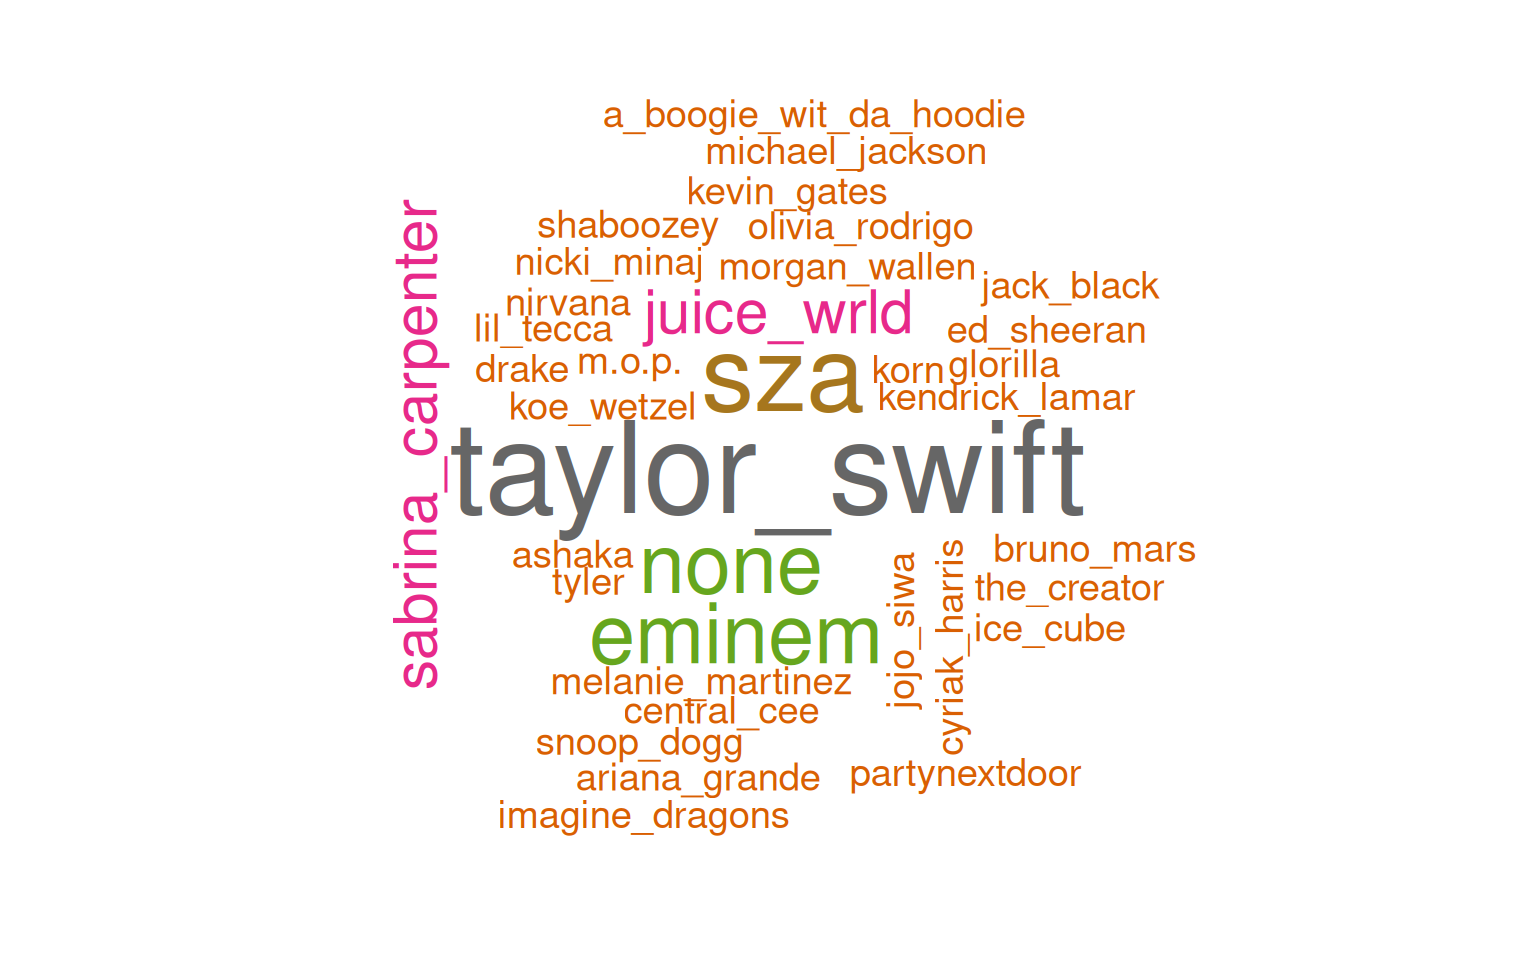
- Word clouds are a great option for analyzing data from free-form responses.
- We can clearly see the difference between 2024 and 2025.
- How do your favorites compare to Google Trends for the past week?
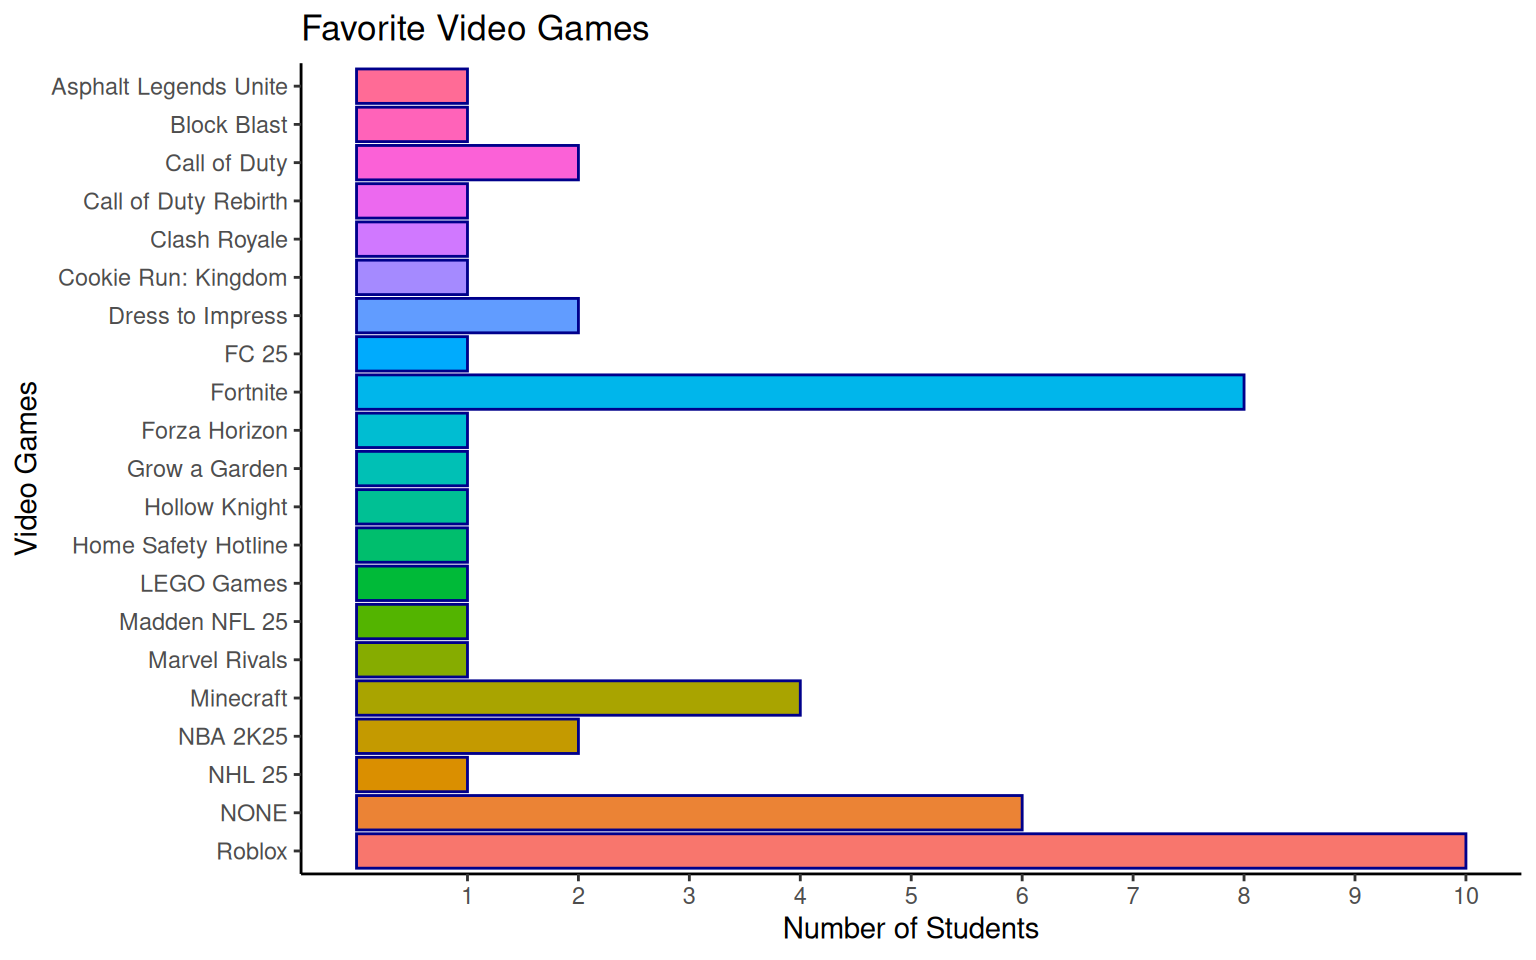
- The question about Video Games also had a free-form response, but there are limited choices:
Roblox: \(\frac{10}{44}=23\%\)
Fortnite: \(\frac{8}{44}=18\%\)
Minecraft: \(\frac{4}{44}=9\%\)
NONE: \(\frac{6}{44}=14\%\)
- These Top 4 Choices: \(64\%\)
- How do your favorites compare to Google Trends for the past week?
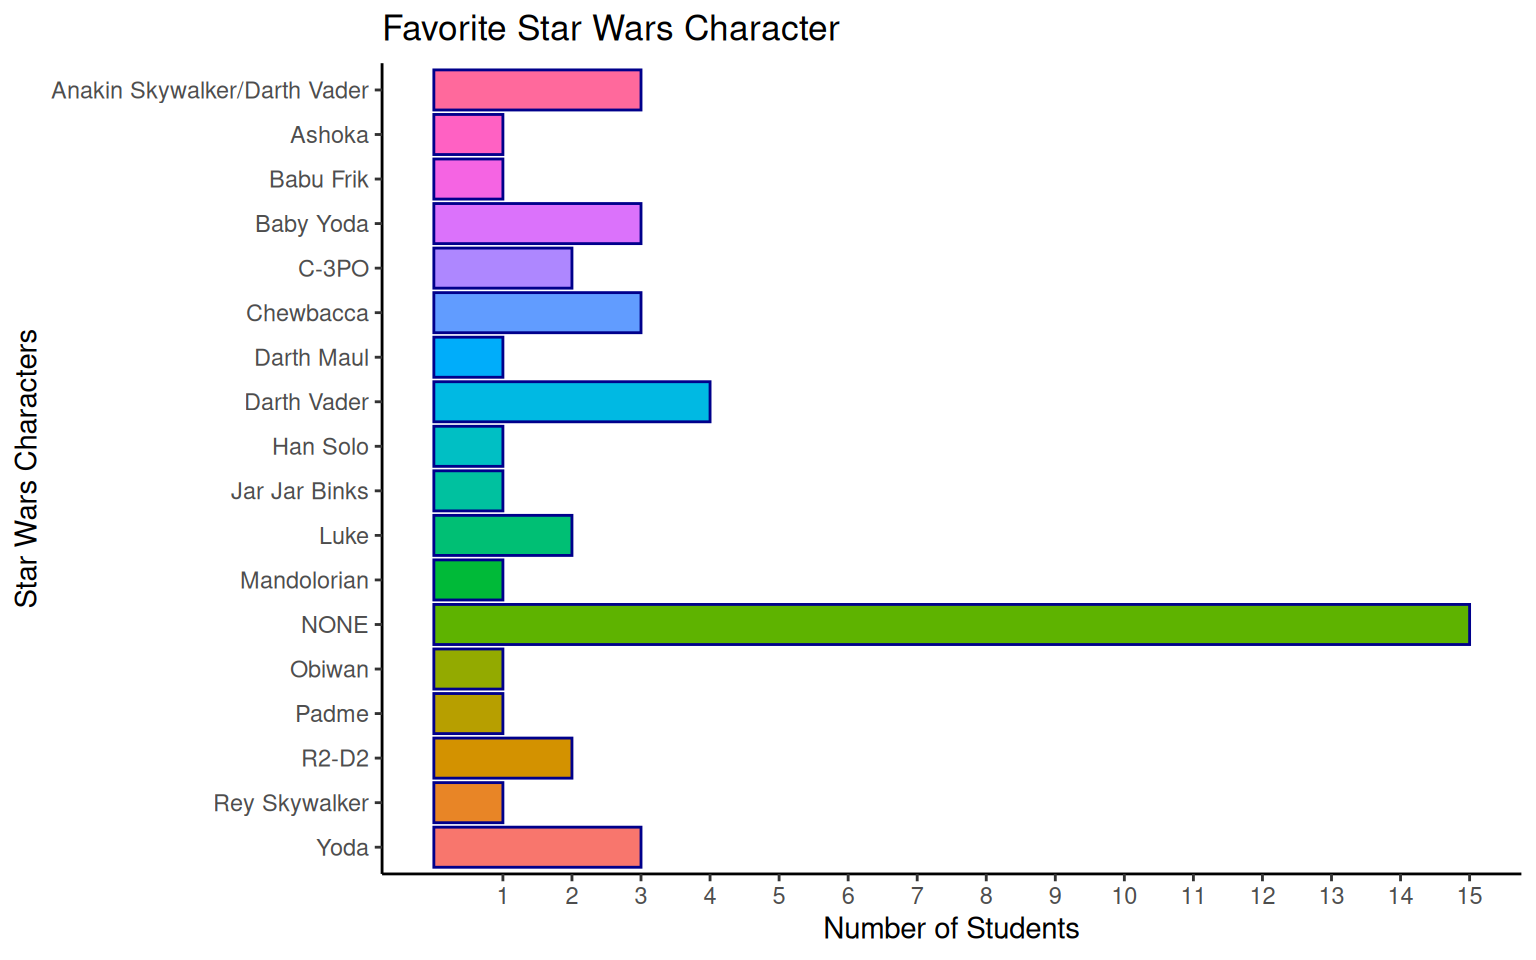
- About \(\frac{1}{3}\) (\(34\%\)) of you have no interest in Star Wars, but plenty of you do.
If we combine the two most common responses besides NONE:
Darth Vader + Anakin Skywalker/Darth Vader:
- \(\frac{3+4}{44}=16\%\)
- The next trilogy may premiere a film as soon as 2026, so you may still get hooked.
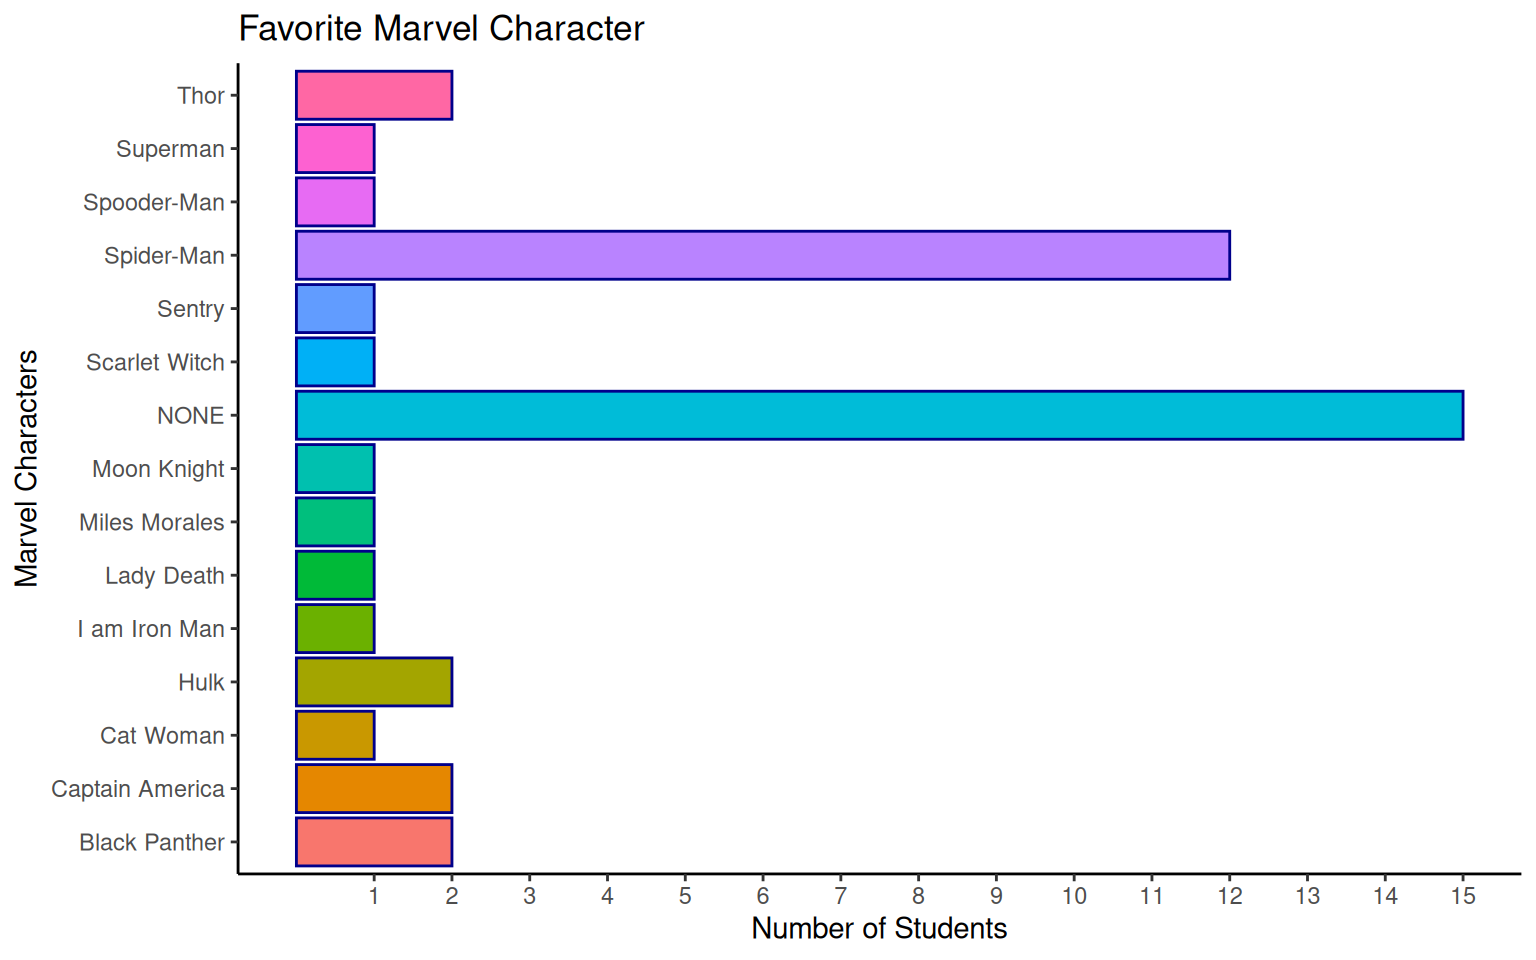

- Spiderman is the most popular (\(\frac{12}{44}=27\%\)) among those who have a favorite Marvel character.
- \(\frac{15}{44} = 34\%\) of you also do not have a favorite Marvel character.
- This led me to check if the same 15 students are uninterested in both Star Wars and Marvel.
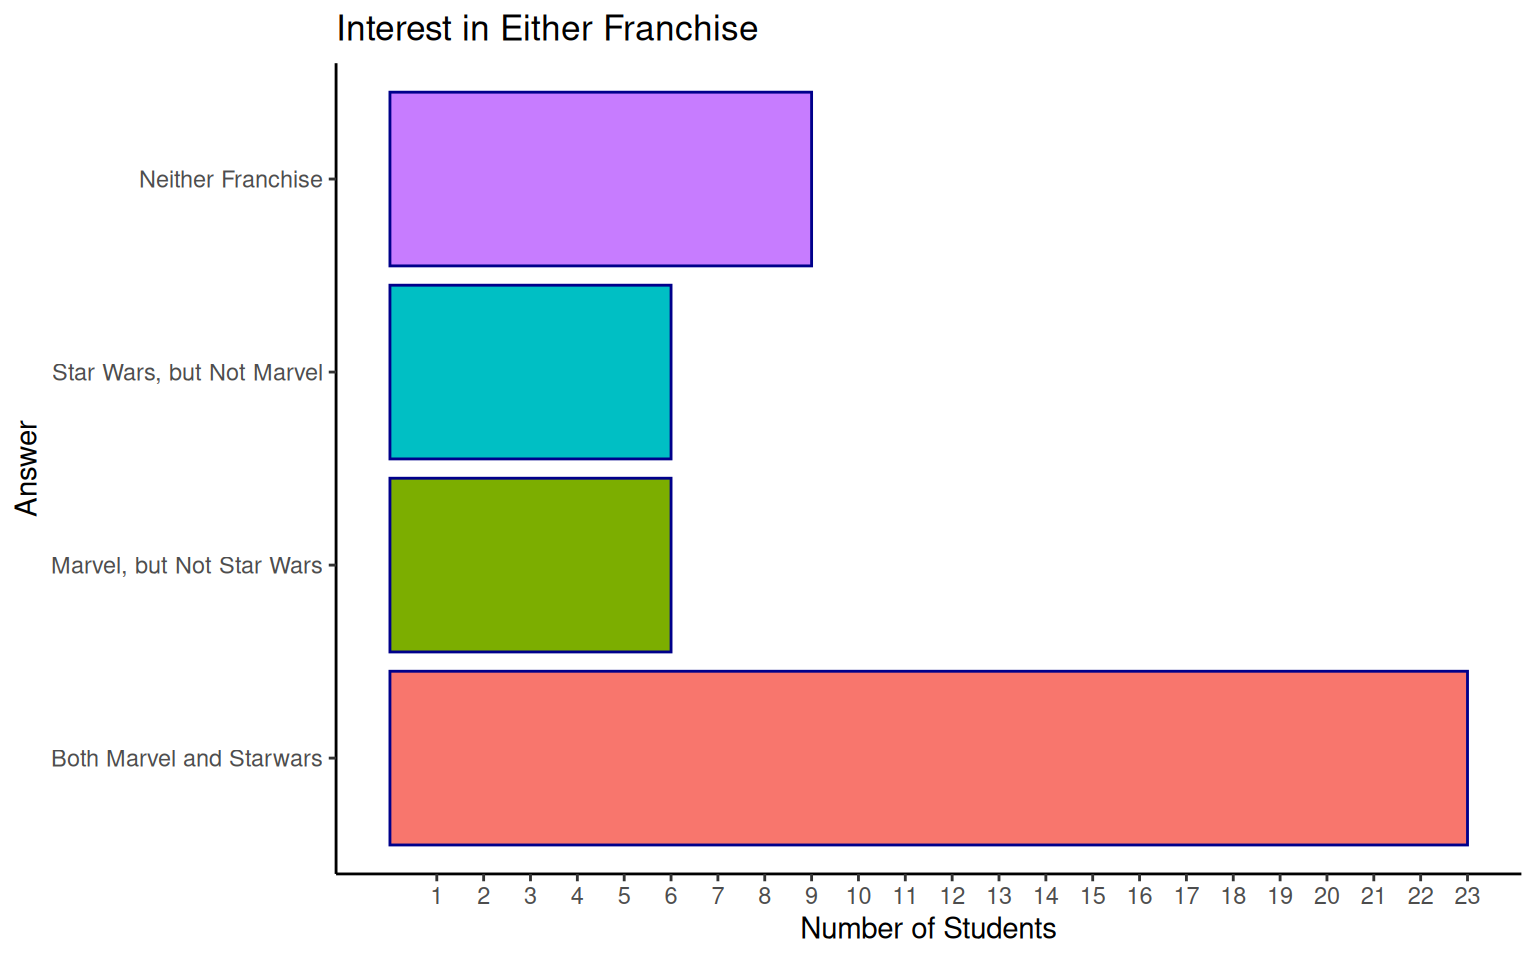
- A fun part of data science is seeing where the data leads you.
In this case I confirmed, that \(\frac{9}{44}=20\%\) were not interested in either franchise so about 80% of you had at least one opinion.
- So….I get a B in 6th grade pop culture.
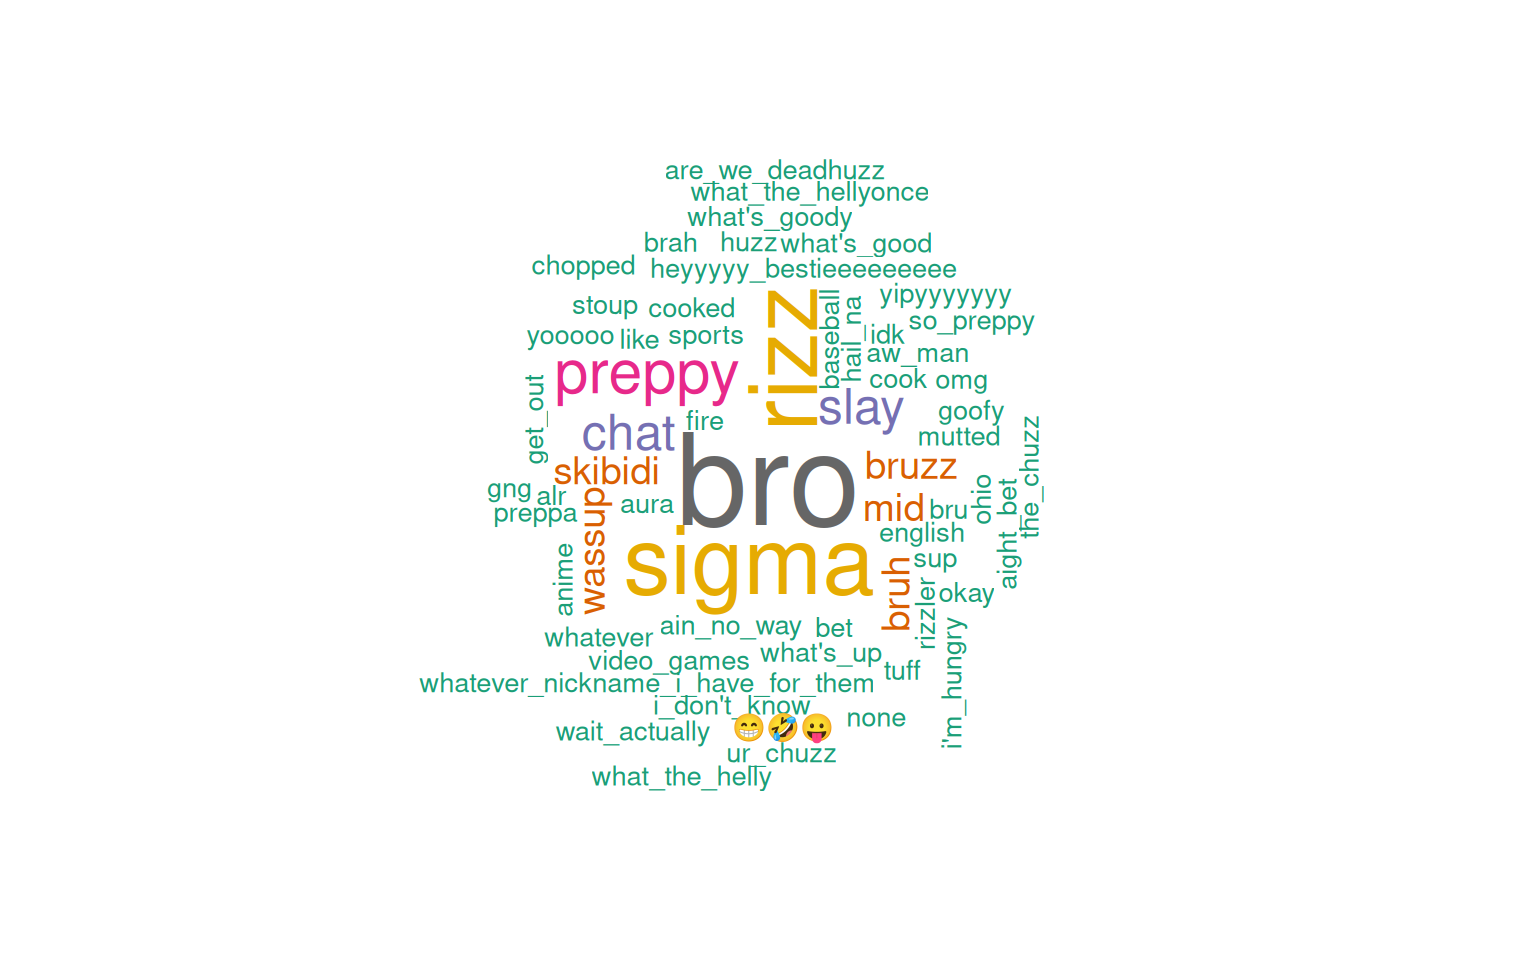

- Saving the best for last, asking about the words you use led to some great answers.
- I had to filter out a couple answers and edit a few so the algorithm would treat them as phrases.
How do your responses compare to Google Trends for the past week?
- Translation: How many older people are trying to figure out what you are saying this week?
This dashboard was created using Quarto in RStudio, and the R Language and Environment.
The data used to create this dashboard were collected from Mrs Walsh’s sixth grade math students using Google Forms.
This presentation was augmented interactively with Google Trends.
Arnold J (2024). ggthemes: Extra Themes, Scales and Geoms for ‘ggplot2’. R package version 5.1.0, https://github.com/jrnold/ggthemes, https://jrnold.github.io/ggthemes/.
Bache S, Wickham H (2022). magrittr: A Forward-Pipe Operator for R. R package version 2.0.3, https://CRAN.R-project.org/package=magrittr.
Fellows I (2018). wordcloud: Word Clouds. doi:10.32614/CRAN.package.wordcloud https://doi.org/10.32614/CRAN.package.wordcloud, R package version 2.6, https://CRAN.R-project.org/package=wordcloud.
Feinerer I, Hornik K (2025). tm: Text Mining Package. doi:10.32614/CRAN.package.tm https://doi.org/10.32614/CRAN.package.tm, R package version 0.7-16, https://CRAN.R-project.org/package=tm.
Feinerer I, Hornik K, Meyer D (2008). “Text Mining Infrastructure in R.” Journal of Statistical Software, 25(5), 1-54. doi:10.18637/jss.v025.i05 https://doi.org/10.18637/jss.v025.i05.
Neuwirth E (2022). RColorBrewer: ColorBrewer Palettes. R package version 1.1-3, https://CRAN.R-project.org/package=RColorBrewer.
Posit team (2025). RStudio: Integrated Development Environment for R. Posit Software, PBC, Boston, MA. URL http://www.posit.co/.
R Core Team (2025). R: A Language and Environment for Statistical Computing. R Foundation for Statistical Computing, Vienna, Austria. https://www.R-project.org/.
Rinker, T. W. & Kurkiewicz, D. (2017). pacman: Package Management for R. version 0.5.0. Buffalo, New York. http://github.com/trinker/pacman
Wickham H, Averick M, Bryan J, Chang W, McGowan LD, François R, Grolemund G, Hayes A, Henry L, Hester J, Kuhn M, Pedersen TL, Miller E, Bache SM, Müller K, Ooms J, Robinson D, Seidel DP, Spinu V, Takahashi K, Vaughan D, Wilke C, Woo K, Yutani H (2019). “Welcome to the tidyverse.” Journal of Open Source Software, 4(43), 1686. doi:10.21105/joss.01686 https://doi.org/10.21105/joss.01686.
Xie Y (2024). knitr: A General-Purpose Package for Dynamic Report Generation in R. R package version 1.48, https://yihui.org/knitr/.
Yihui Xie (2015) Dynamic Documents with R and knitr. 2nd edition. Chapman and Hall/CRC. ISBN 978-1498716963
Yihui Xie (2014) knitr: A Comprehensive Tool for Reproducible Research in R. In Victoria Stodden, Friedrich Leisch and Roger D. Peng, editors, Implementing Reproducible Computational Research. Chapman and Hall/CRC. ISBN 978-1466561595
- Thank you, again, for completing the survey and for having me join you!
- Questions?
\[\frac{24+8}{44}=\frac{32}{44}=0.73 = 73\%\]Clearly, YouTube is popular.
73% of students chose YouTube as their first or second choice: